Graph-Based Visualization of Stochastic Dominance in Statistical Comparisons
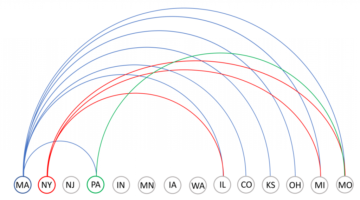
In this paper, a graph visualization scheme and methodology is proposed for representing, understanding, and interpreting the statistical comparison of means and the resulting stochastic dominance. The practicality and applicability of the visualization scheme and the methodology is illustrated through a case study, with data coming from higher education institutes in the United States of … Continue reading Graph-Based Visualization of Stochastic Dominance in Statistical Comparisons